Tareef Core Softwareالعربية

Meter readings, from photo to decision

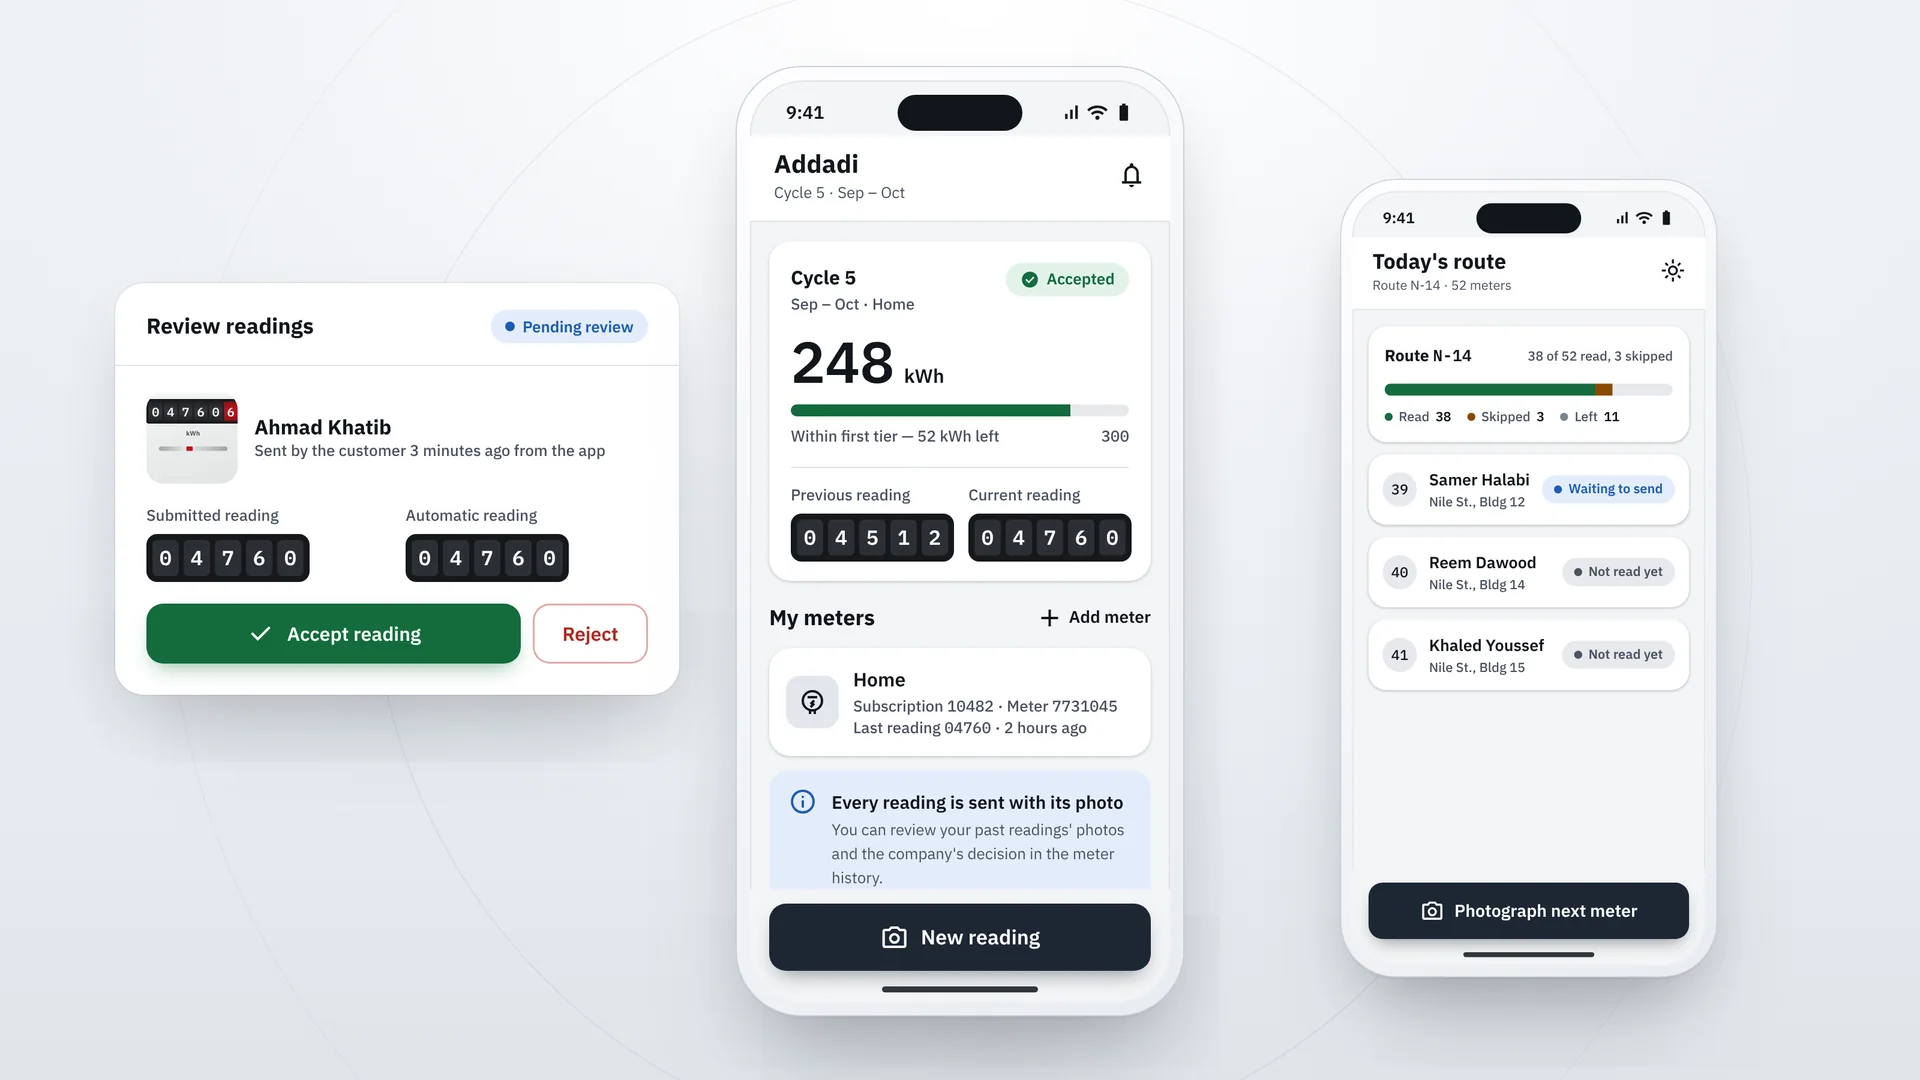
Addadi brings customers, meter readers and the utility together around a single reading. Customers send their reading as a photo from their phone, field readers cover the remaining meters, and the office reviews every reading with its photo before it counts.

A customer app, a reader app that works offline, and a company dashboard that follows the cycle as it happens. Three interfaces on one set of data, so no reading gets lost between paper and spreadsheets.

The customer app showing 248 kWh this cycle within the first tier and a New reading button, beside the reader app with today's route and a review card on the company dashboard with an Accept reading button.
How it works

From the customer's photo to the utility's decision

Customer app

One photo is all it takes

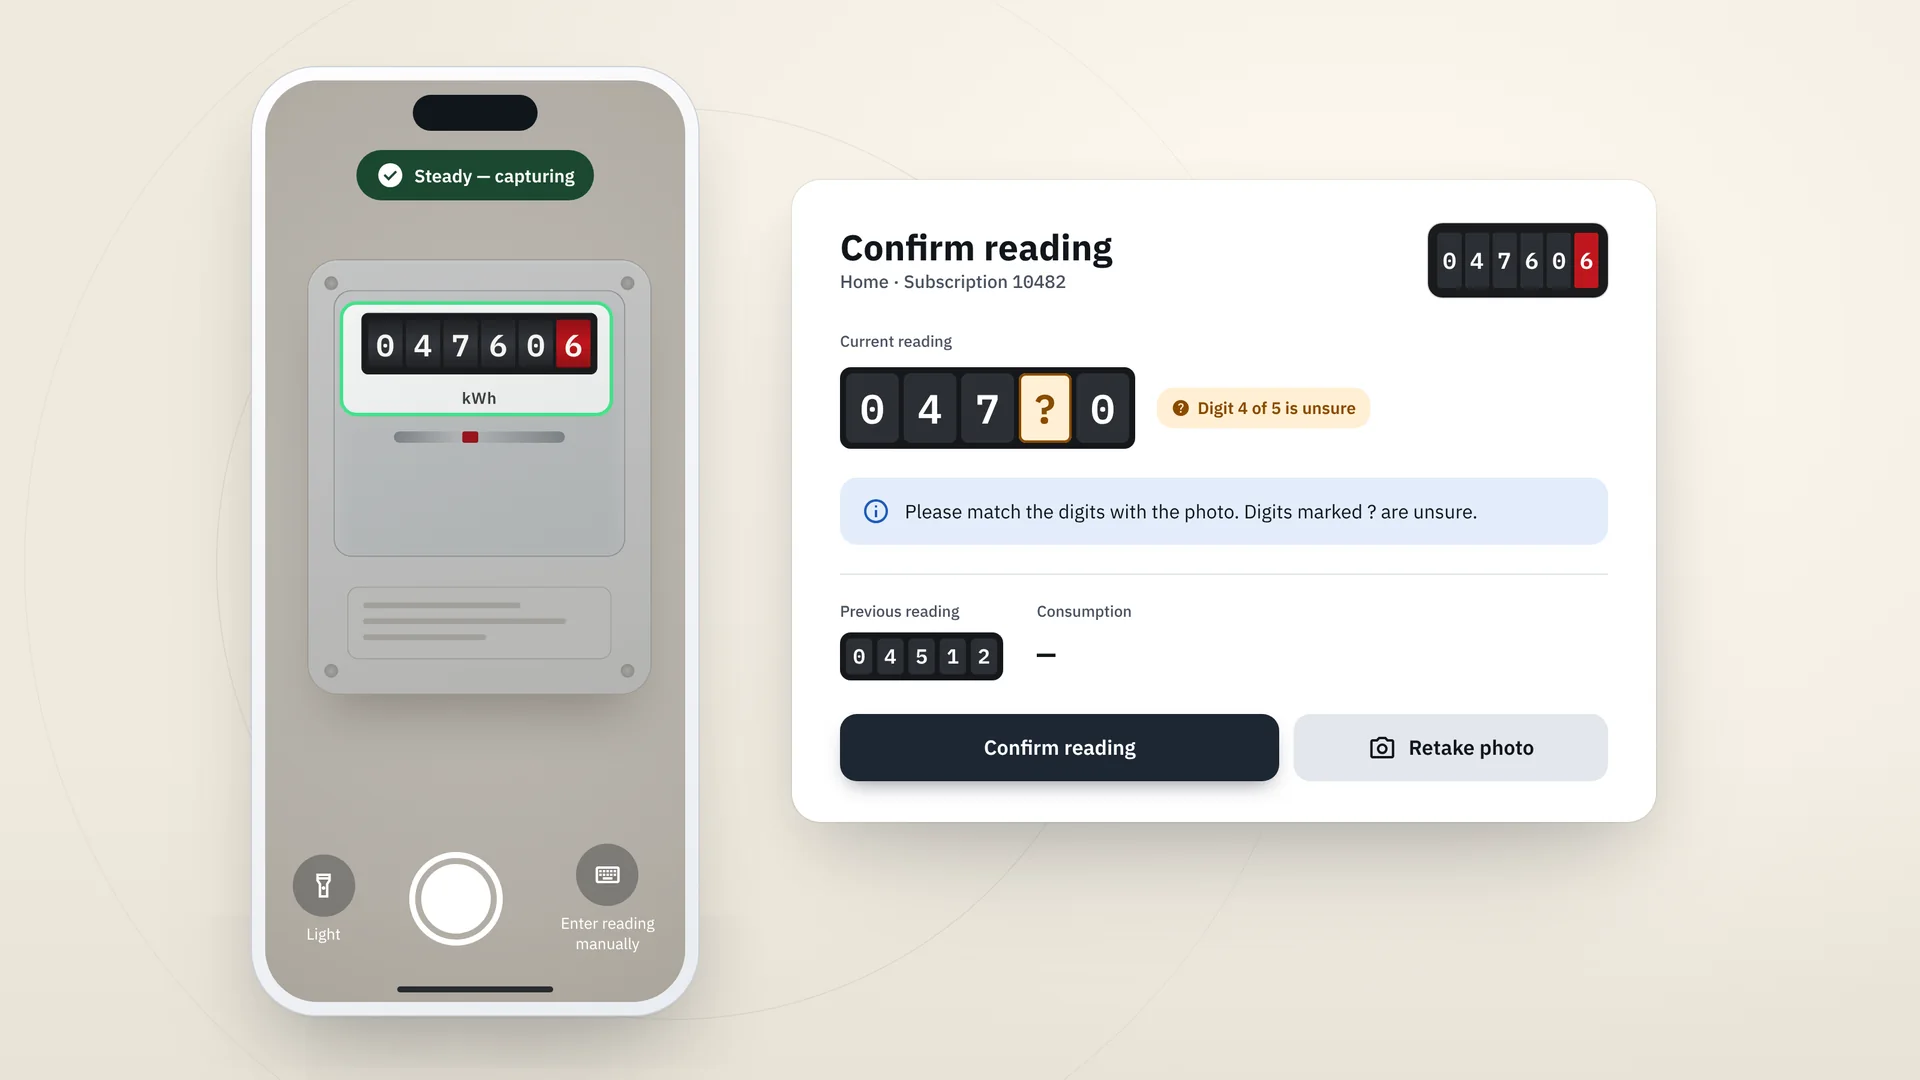
Customers point the camera at the meter digits. The app captures the photo once the phone is steady and reads the digits on the device itself. The reading appears ready to confirm, with any unclear digit marked so the customer can check it against the photo.

If the light is too low or the photo is shaky, the app says so before capturing, and the reading can always be typed in or the photo retaken. Every reading is sent with its photo as evidence.

The camera aimed at the meter digits with a Steady, capturing notice, beside the Confirm reading screen where one unsure digit is marked with a question mark.
Office review

Review every reading with its evidence

Readings arrive in the review queue on the company dashboard. The reviewer sees the meter photo, the submitted reading, the automatic reading taken from the photo, the previous reading and the consumption, then accepts it in one click or rejects it with a reason the customer receives.

The system flags what deserves a closer look: higher than usual consumption, a reading lower than the previous one, a difference from the automatic reading, or a reading taken far from the meter. Each reading is held by one reviewer at a time, so no two people review it at once.
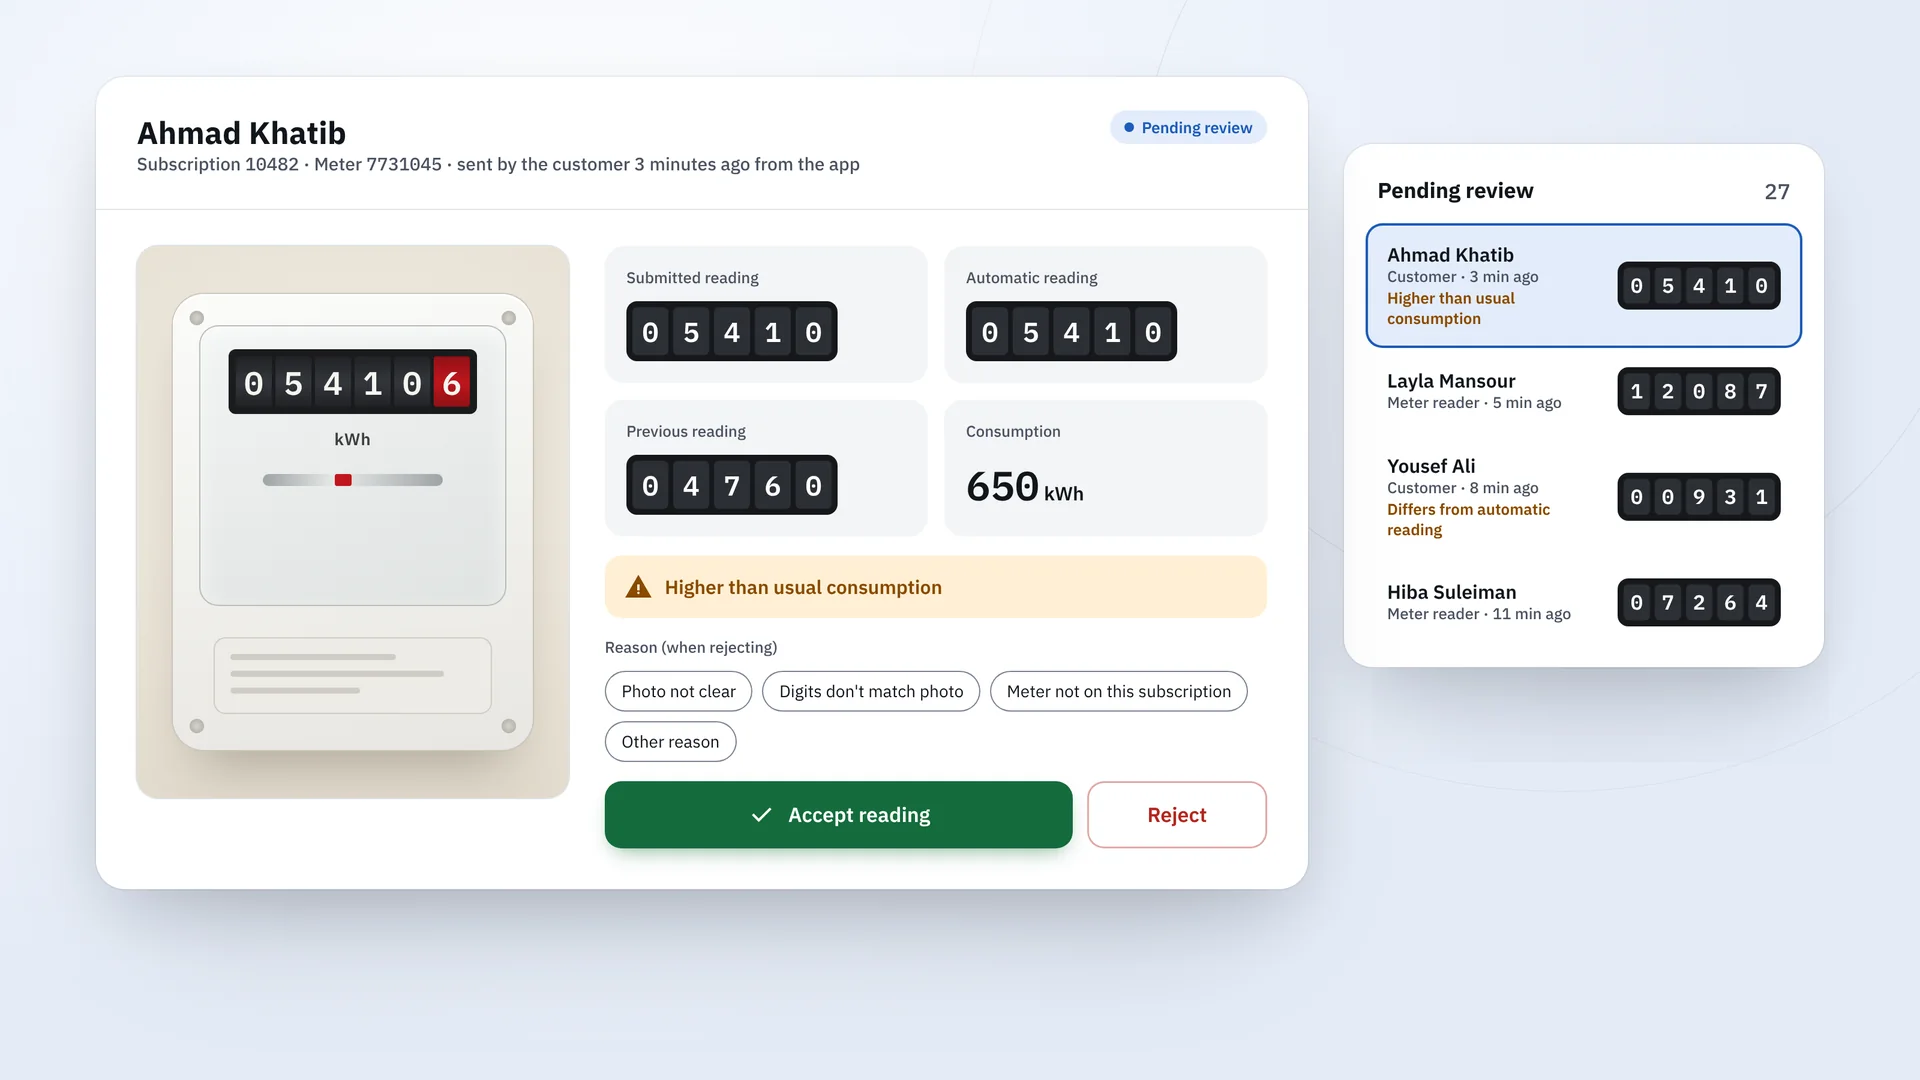
A reading pending review: the meter photo, the submitted, automatic and previous readings, 650 kWh consumption flagged as higher than usual, the reject reasons and the accept and reject buttons, beside the queue of pending readings.
Reader app

Field readers who keep going offline

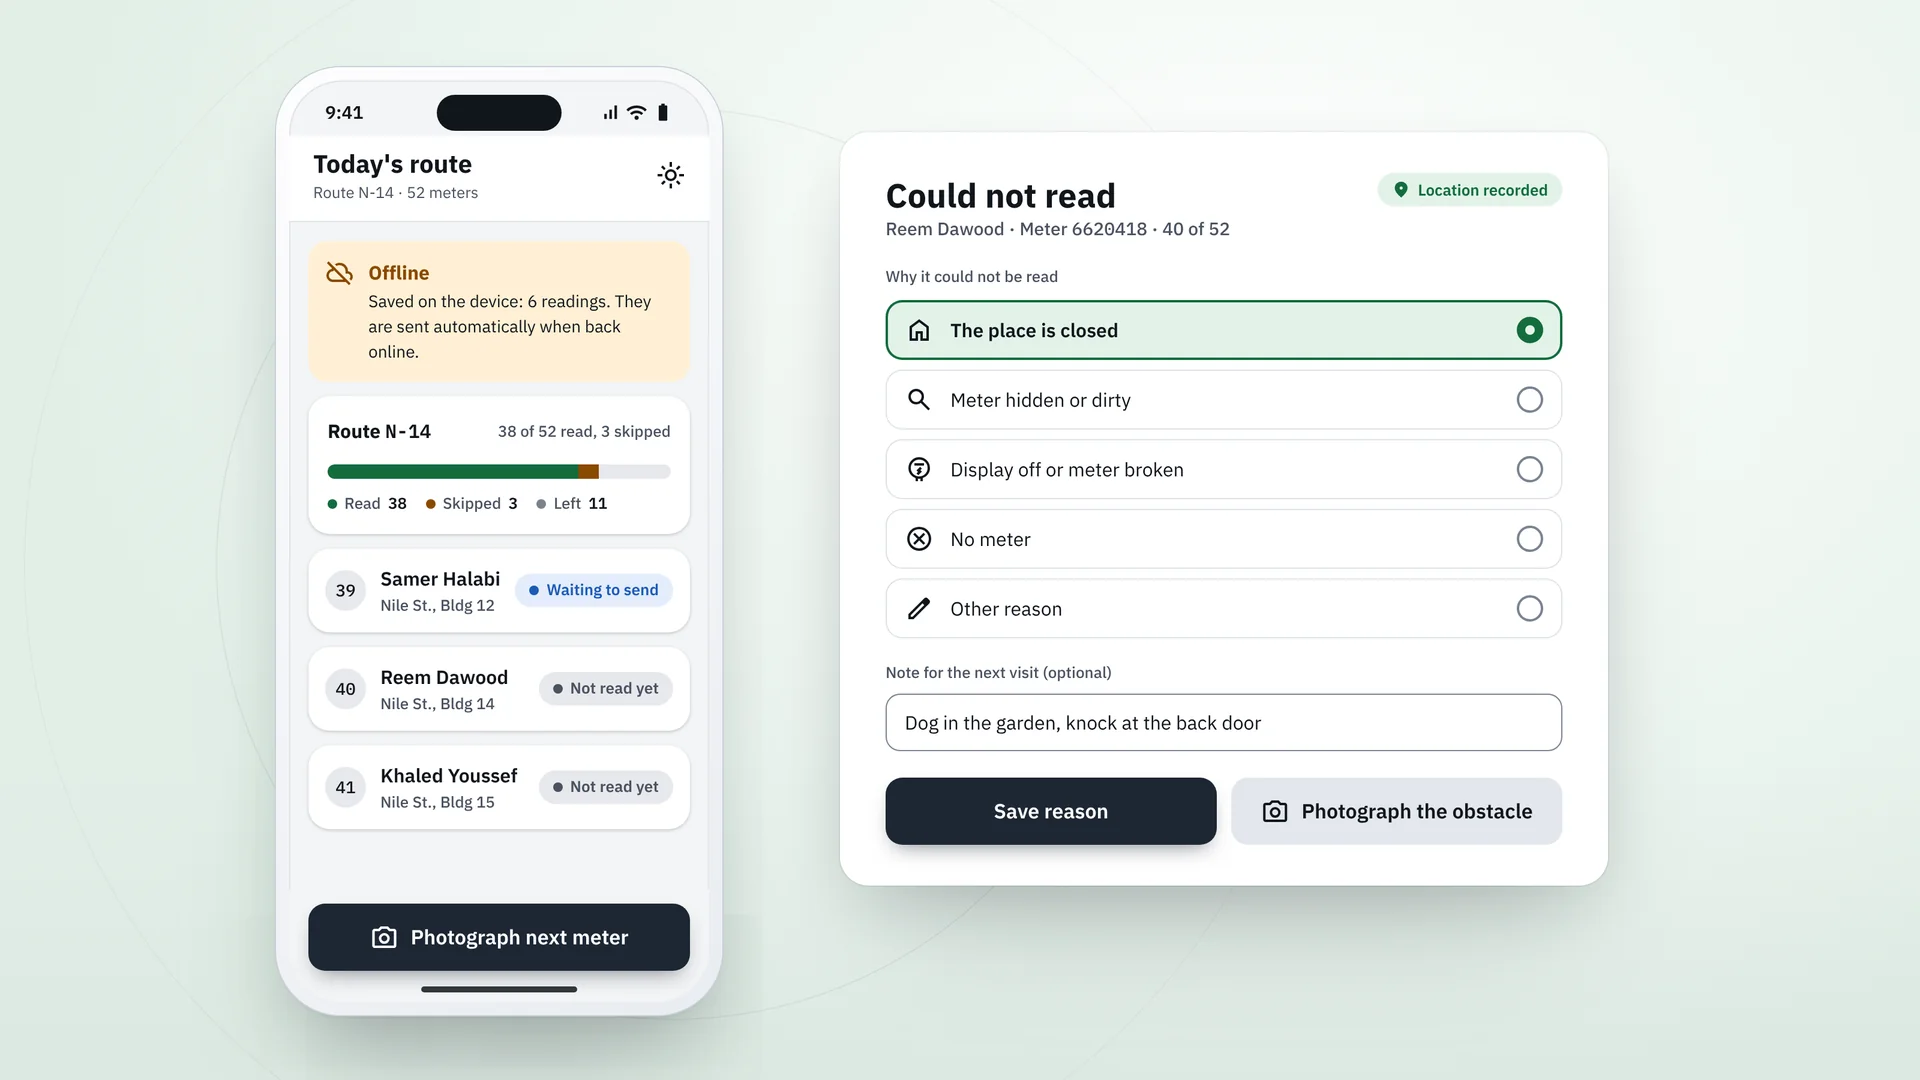
Readers download the day's route to their phone once, then work without internet. They photograph each meter, location and time are recorded with every photo, and readings stay on the phone until they are sent automatically when the connection returns.

When a meter cannot be read, the reader picks the reason, attaches a photo of what is in the way, and leaves a note for whoever visits next. The day summary shows what was read, what was skipped and what is left.

Today's route in the reader app while offline, with six readings saved on the device and route progress, beside the Could not read form with its reasons and a note for the next visit.
Live dashboard

The whole cycle in view, without refreshing

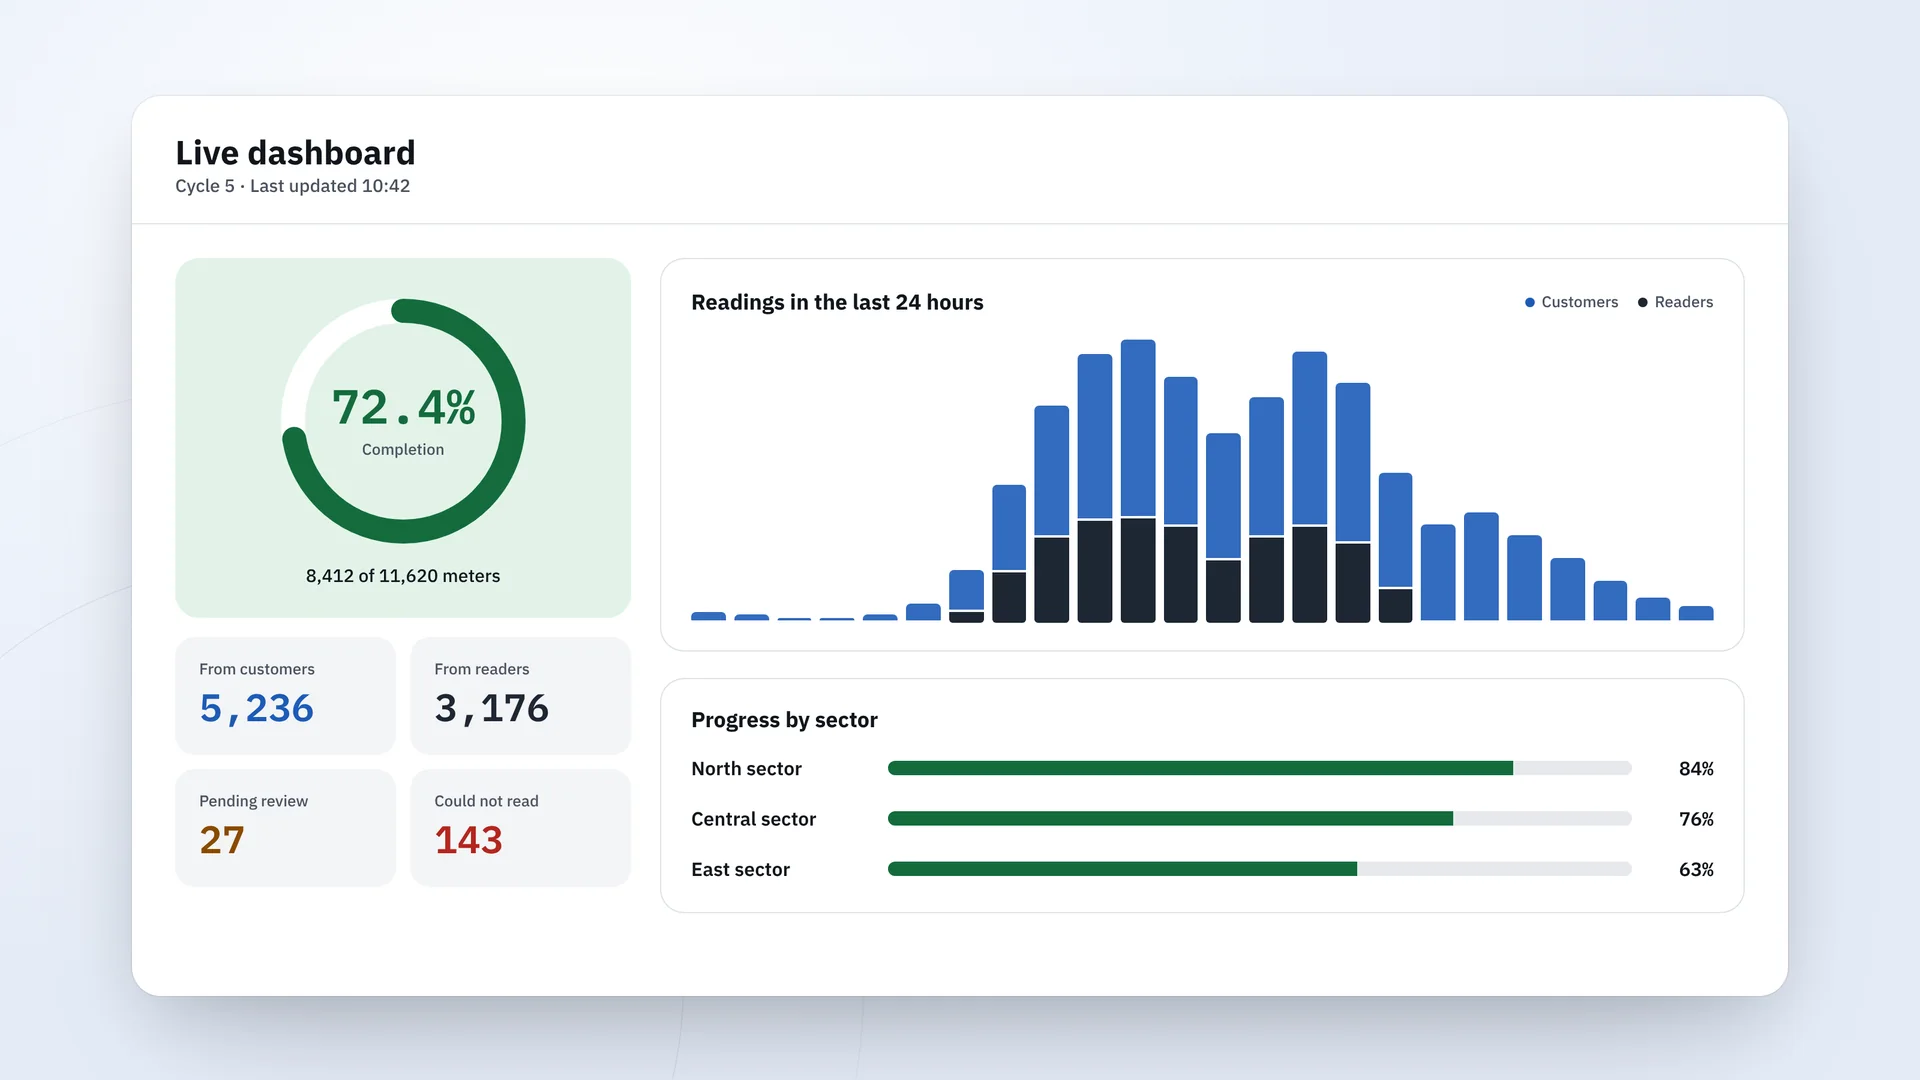
The live dashboard shows cycle completion, readings received from customers and from readers, what is waiting for review and what could not be read, and progress by sector and route. The numbers move on their own whenever a reading arrives or is reviewed.

Each user sees only the sectors assigned to them, along with readings over the last 24 hours, the latest arrivals, and today's map of meters coloured by reading status.

The live dashboard at 72.4% cycle completion, with readings from customers and readers, pending reviews, a chart of readings over the last 24 hours and progress by sector.
Usage and history

Clear usage and an open history

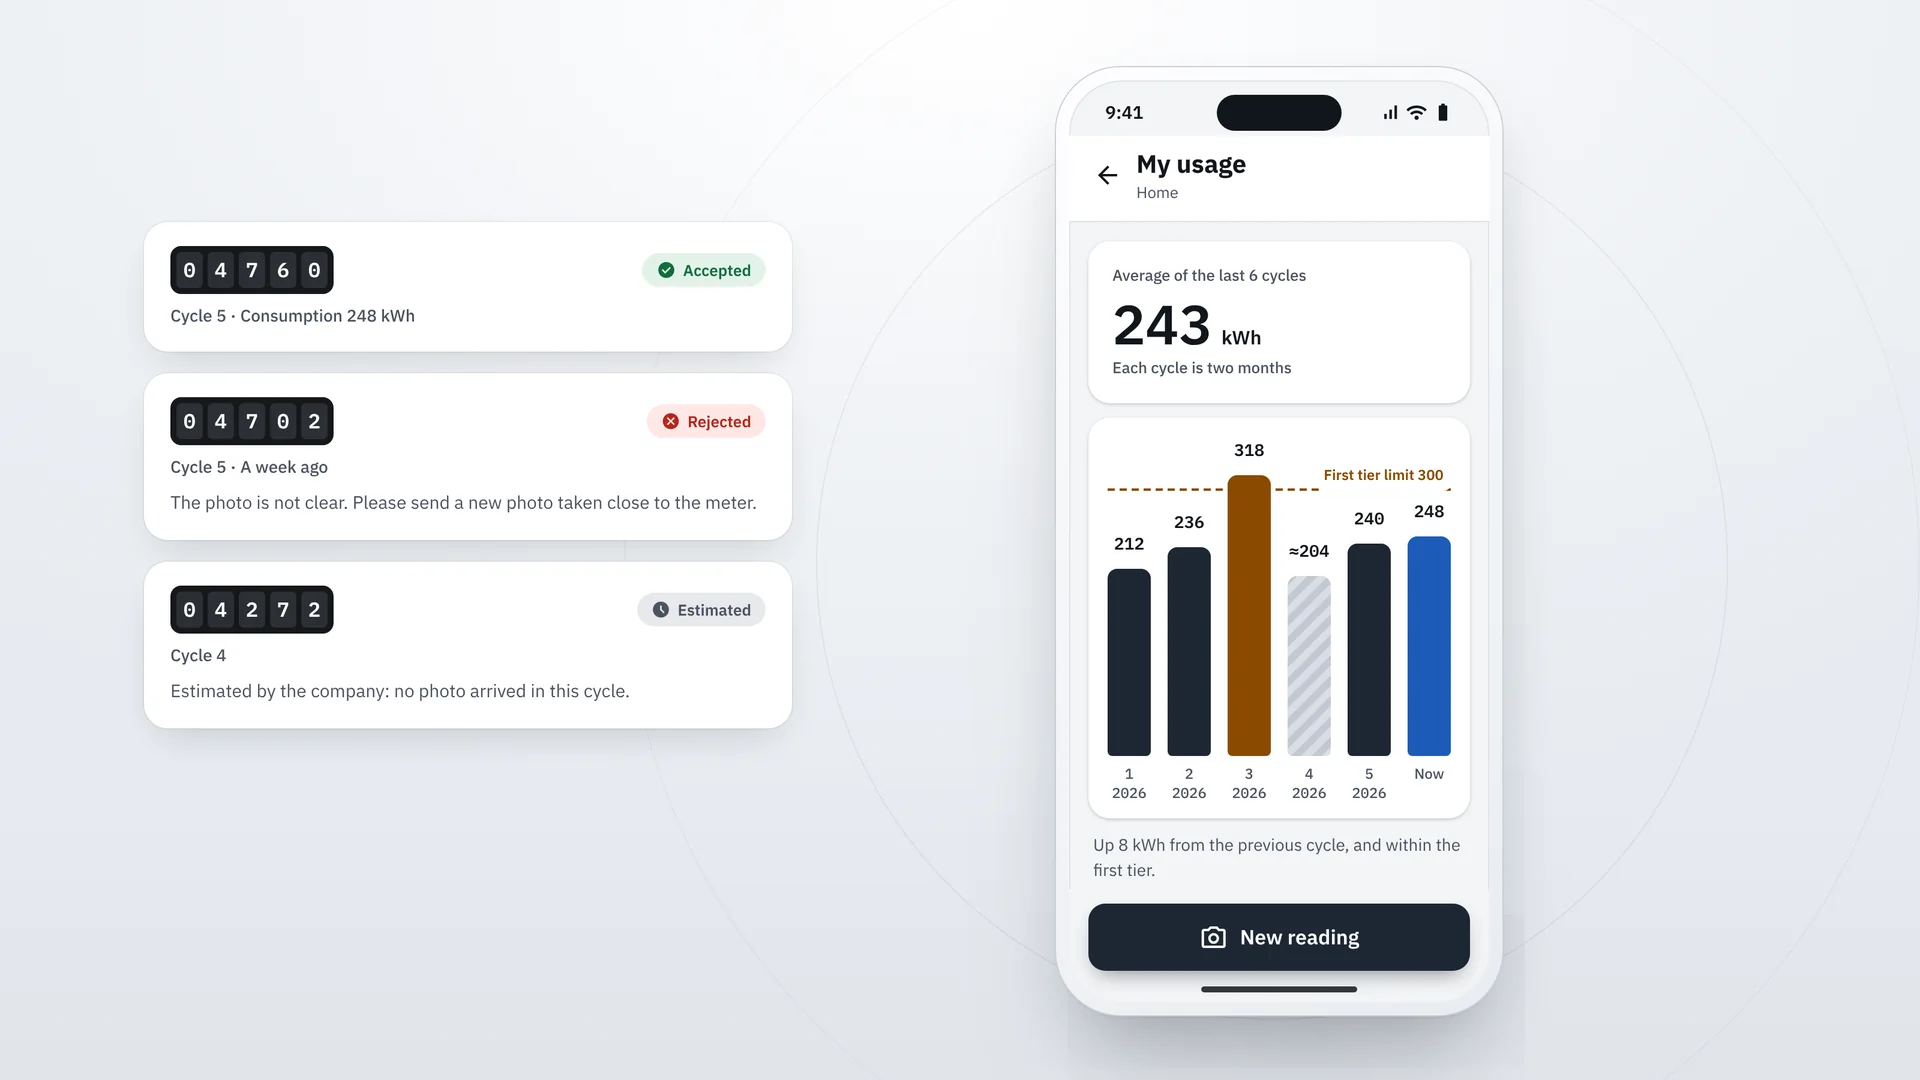
Customers see their consumption over the last six cycles against the first tier limit, their average, and the change from the previous cycle. The meter history lists every reading they sent, with its photo and the company's decision.

When a reading is rejected, the reason and the next step are shown. When no photo arrives in a cycle, the estimated reading is clearly marked. A reminder arrives at the start of every reading cycle.

The My usage screen with the six-cycle average and a bar chart against the first tier limit, beside accepted, rejected (with its reason) and estimated readings.
Reports and access

Ready reports and precise permissions

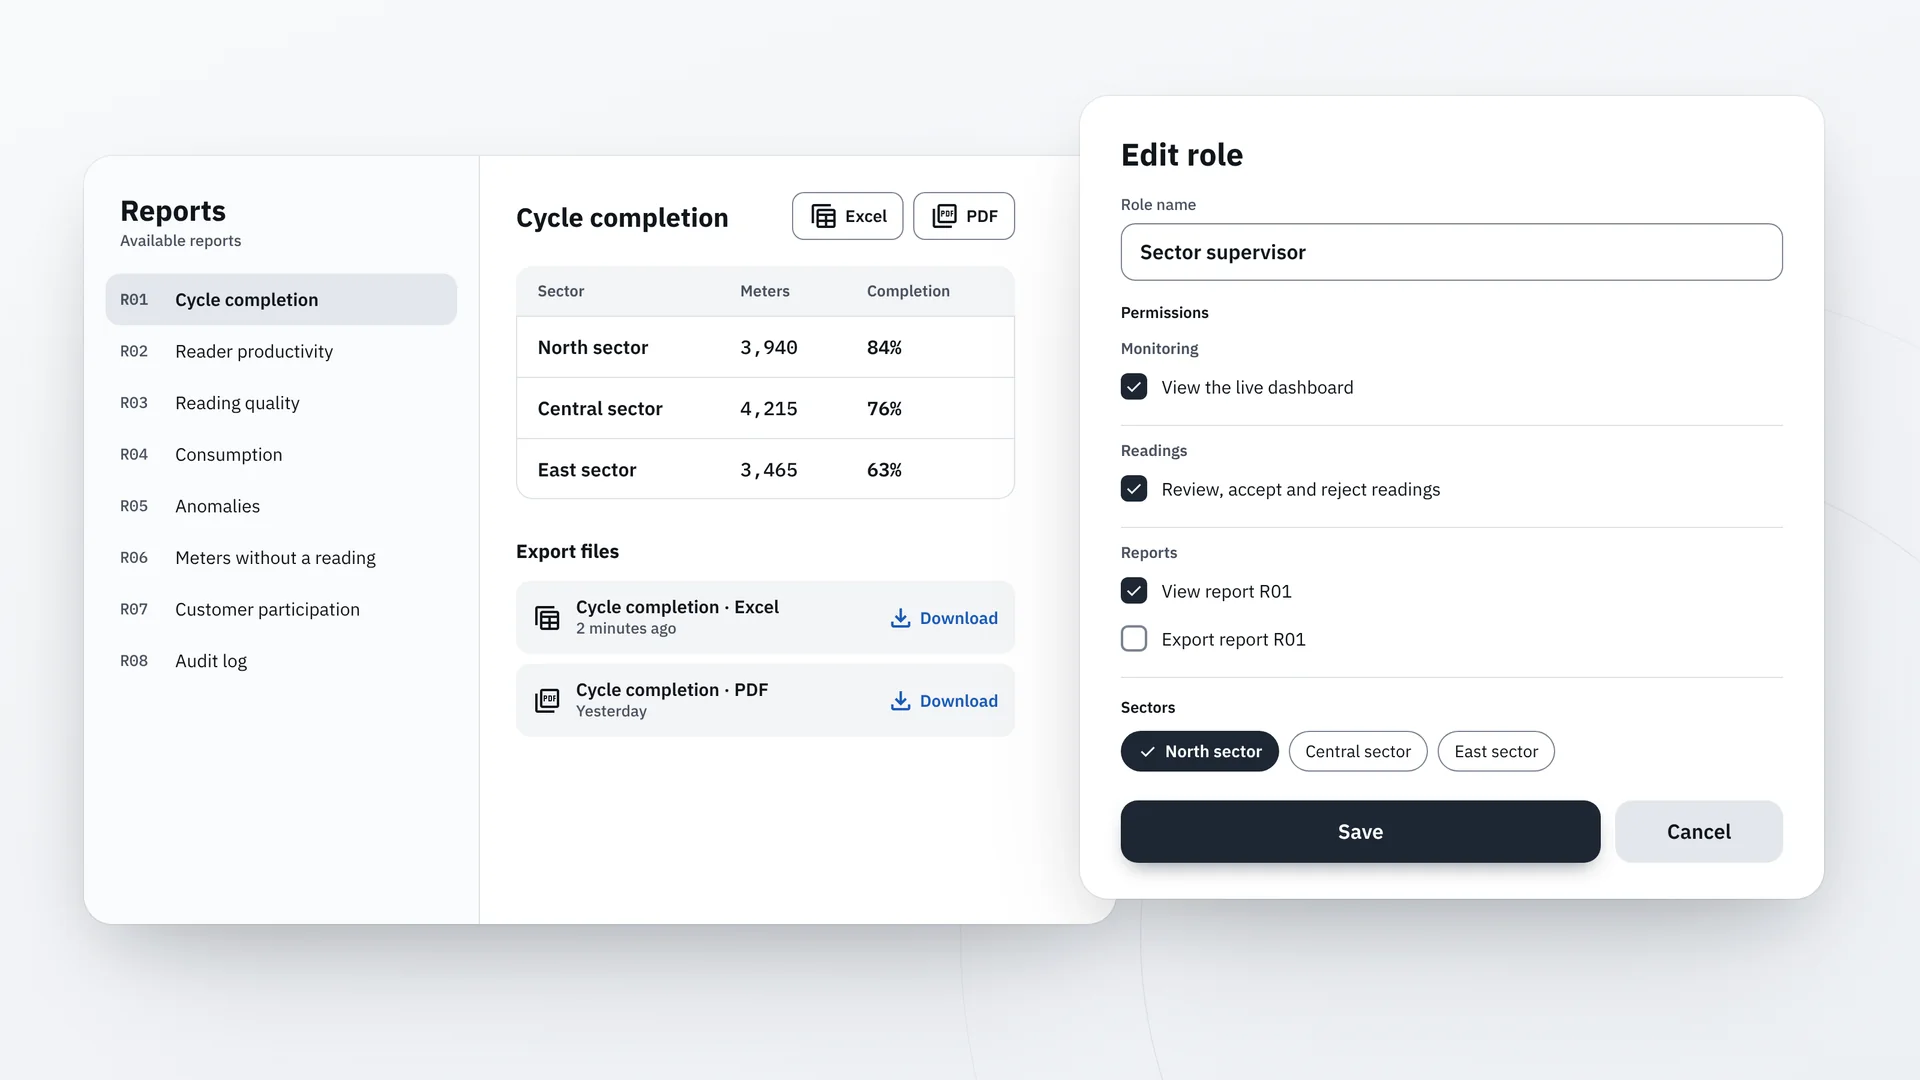
Eight cycle reports, from completion and reader productivity to anomalies and meters without a reading, shown on the dashboard or exported to PDF and Excel. Every role has its own permissions over pages, reports and sectors.

Administrators decide what a sector supervisor can see and export and which sectors are theirs, and pages a user may not open disappear from the menu. Every sensitive action is kept in the audit log.

The list of eight reports with the cycle completion report and its Excel and PDF export, beside the Edit role dialog for a sector supervisor with its permissions and sectors.